
Dashboard Sections
Group widgets, show a group only to the devices it applies to, or repeat a group once per item the device reports.
The Monitoring Dashboard of a device model is built from sections. A section is a named group of widgets that renders as one row on the device's Overview tab, and sections stack in the order you set.
Every section behaves in one of these ways:
| Section | Shows | Use it when |
|---|---|---|
| Regular | On every device of the model | The widgets are the same for all devices |
| Conditional | Only on devices where one or more paths are truthy | Only some devices have the feature |
| Lab only | Only to lab accounts | You're testing widgets on a published model |
| Dynamic | Once per item the device reports in a list | The device has a variable number of ports, channels, zones… |
Conditional, lab-only and dynamic combine: a dynamic section can also carry a condition, and any section can additionally be limited to lab accounts.
Creating a section
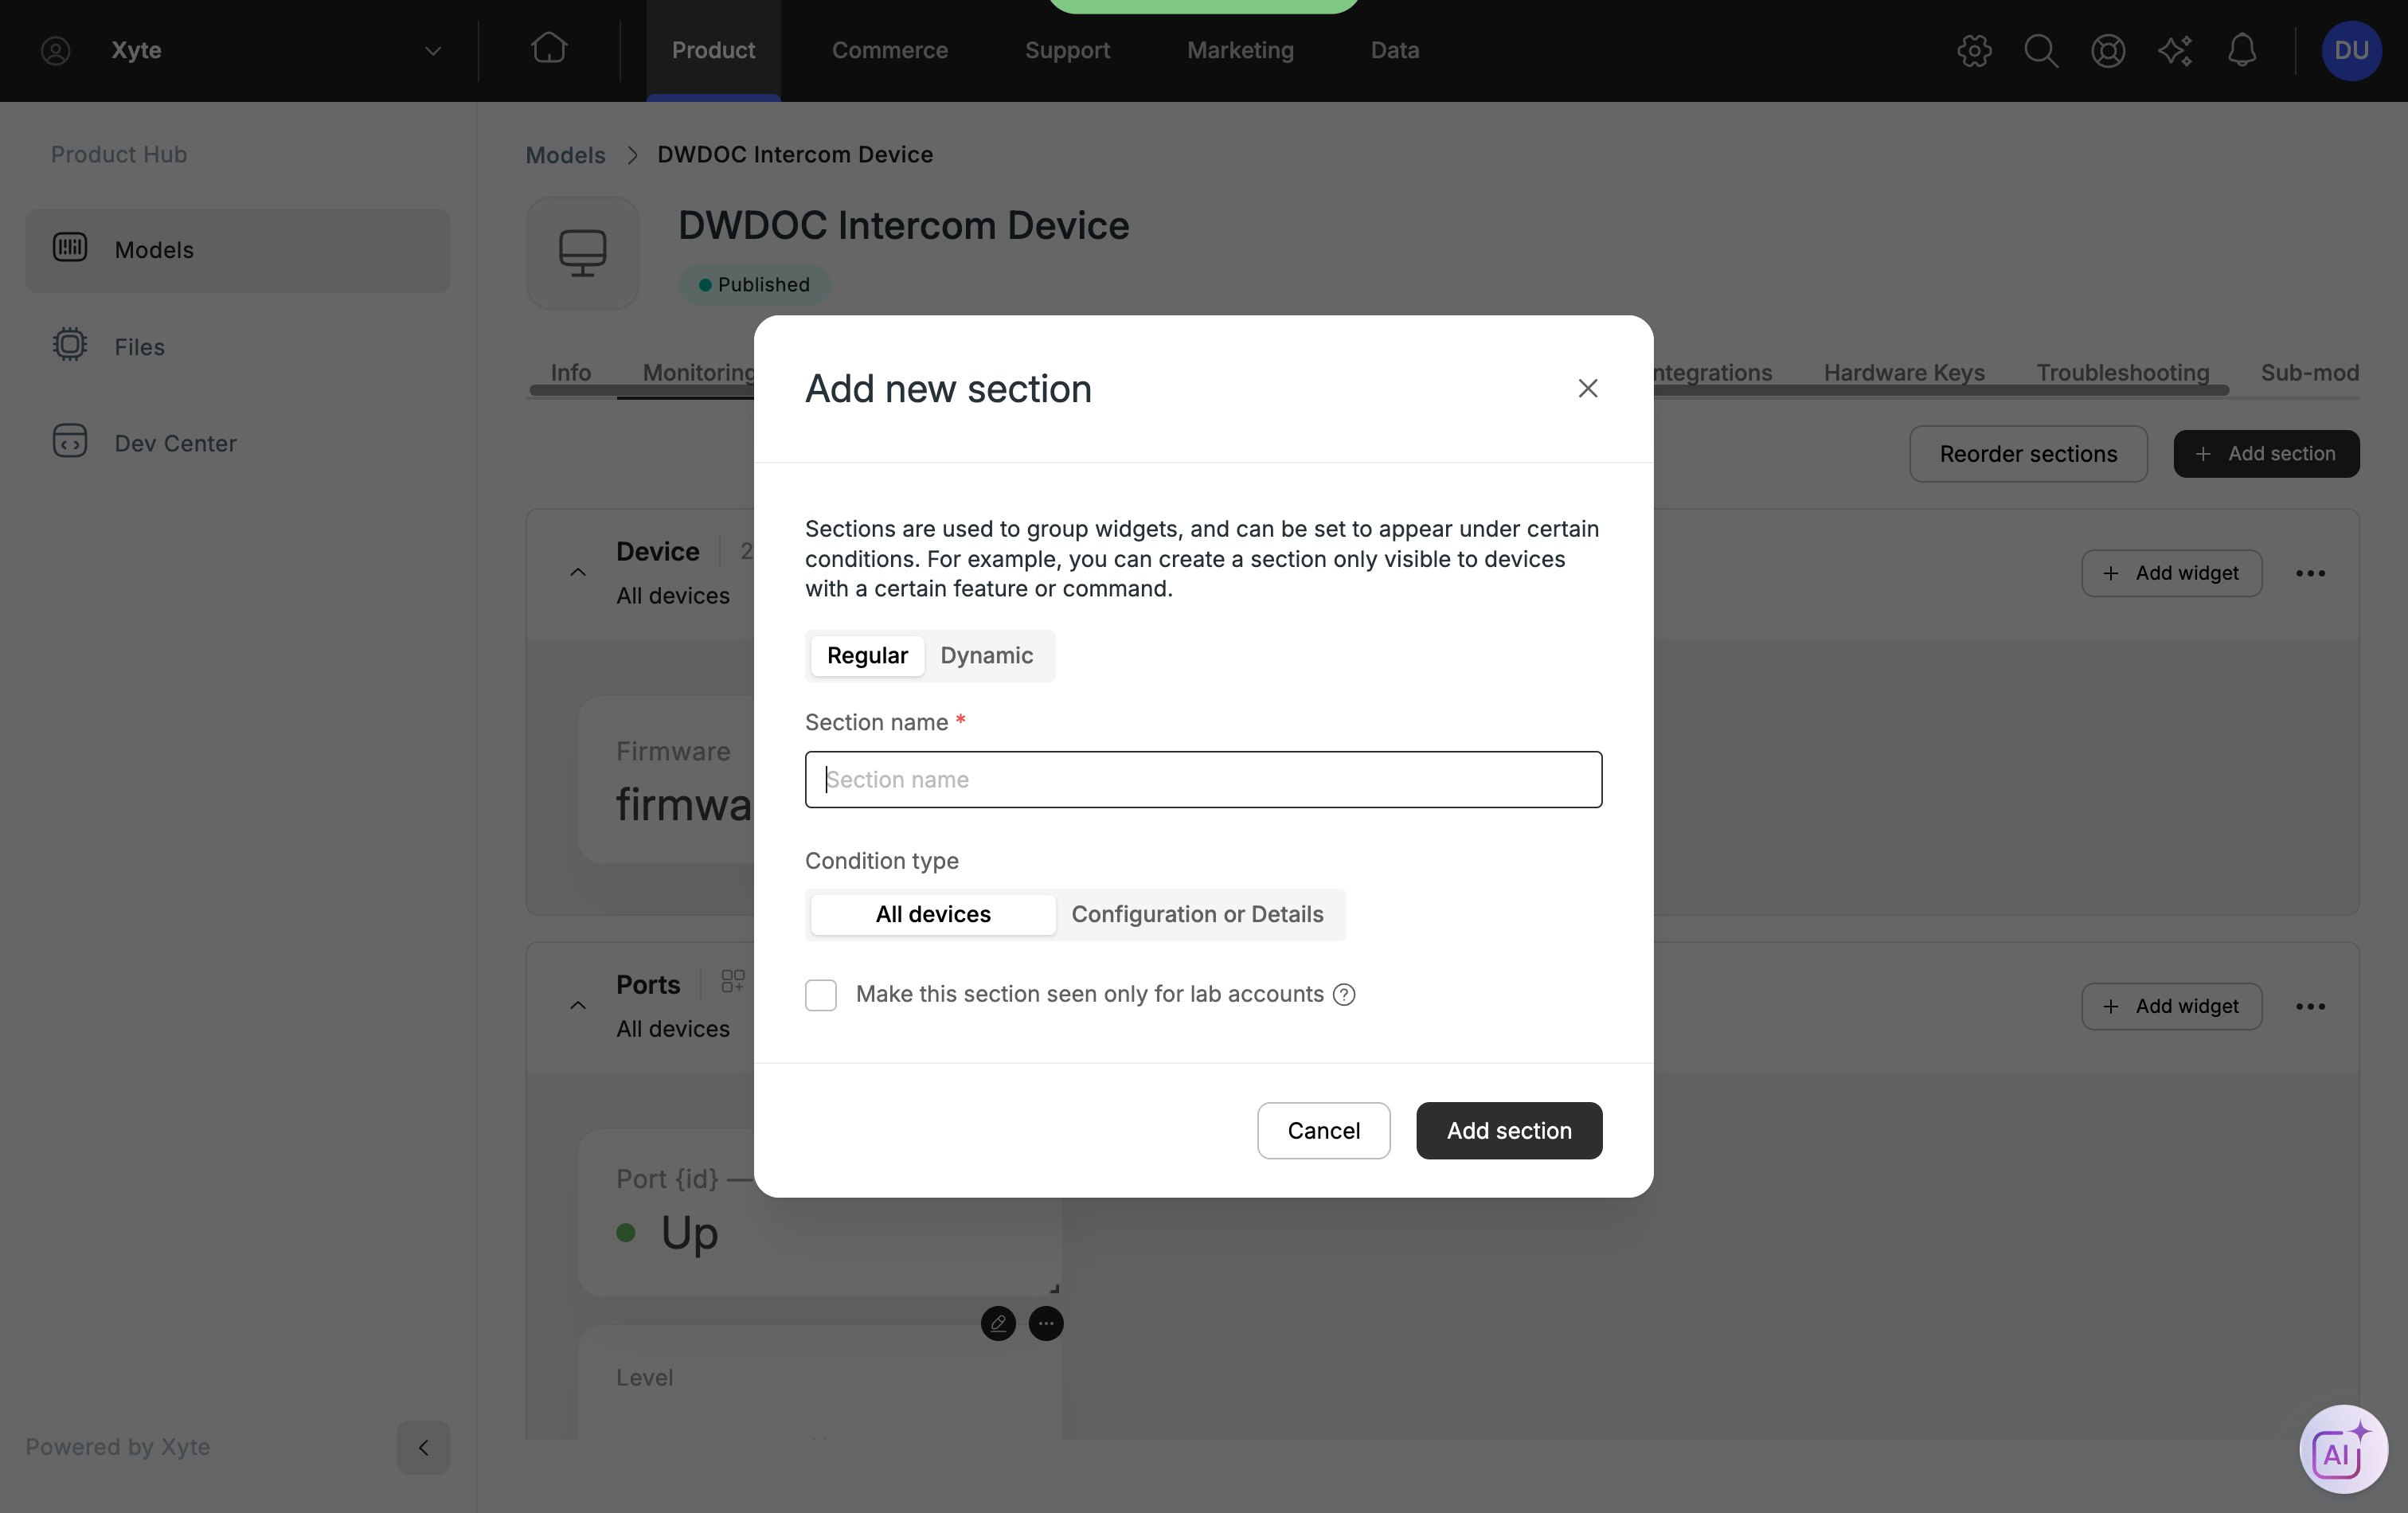
Go to Products → your model → Monitoring dashboard → Add section. Use Reorder sections to change the order they appear in.
Regular sections
The default. Set a name, leave Condition type on All devices, and add widgets. Every device of the model shows the section.
Lab-only sections
Tick Make this section seen only for lab accounts to keep a section hidden from real customers while you build it on a published model.
If the section also has a condition, both must pass: a lab account still won't see the section unless the path is truthy.
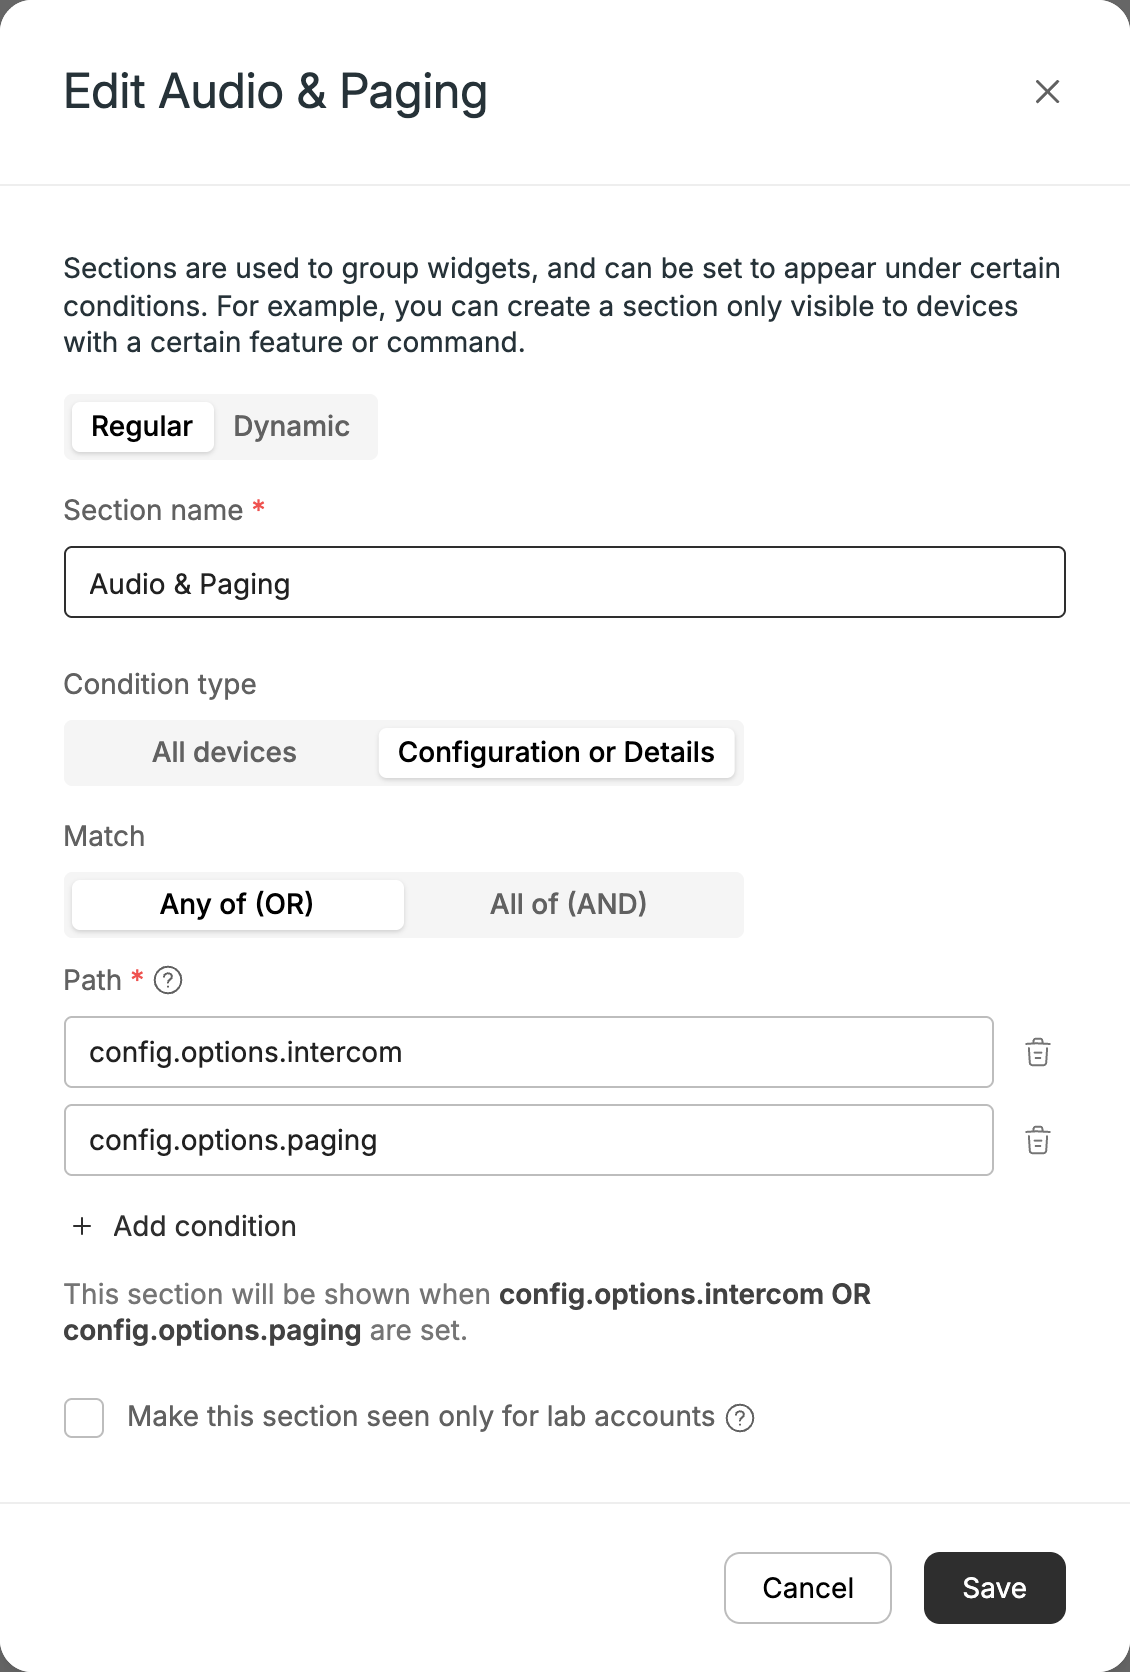
Switch Condition type to Configuration or Details and enter a Path. The section appears only on devices where that path holds a truthy value.
To base the section on more than one path, click Add condition and enter another path. As soon as there are two or more, a Match control appears:
- Any of (OR) — the section shows when at least one of the paths is truthy
- All of (AND) — the section shows only when every path is truthy
Below the paths, the dialog spells out the resulting rule — e.g. "This section will be shown when config.options.intercom OR config.options.paging are set" — so you can check it before saving. Remove a path with the bin icon next to it.
The path is read against the device, so it can point into:
config.…— the device's configuration, e.g.config.options.surround_enableddetails.…— the device's details, e.g.details.has_camerastate.…— a telemetry key
Telemetry paths are matched as a single flat key after the state. prefix, so a key that itself contains dots still works.
What the condition can and can't do
Each path is evaluated for truthiness on its own. The condition is not an expression language.
- Missing,
null,false,0and empty string → the path counts as not set - Any other value → the path counts as set
Combining paths is done with Add condition and Match, not by typing into the field. Writing config.options.option1 or config.options.option2 into a single path is treated as one literal path, matches nothing, and the section never appears.
There is no comparison (such as "firmware version 1.11 or higher") and no "show when not set" — a condition cannot be inverted.
One section for several optionsIf a section should appear when either of two options is set, add both paths and choose Any of (OR). A device that has both options still shows the section once — there is no need to duplicate the section per option.
If instead each option should bring its own widgets, use a Dynamic section — it renders one group per item the device reports.
Troubleshooting
| Symptom | Likely cause |
|---|---|
| Section never appears | A path was typed as an expression (a or b) instead of added as a separate condition, the value is missing/false on the device, or All of (AND) is selected and one of the paths isn't set |
| Section appears on every device | The path resolves to a truthy value everywhere — any non-empty value counts, including the string "false" |
You build the widgets once, on the model — the section holds a single set of widget definitions no matter how many devices use it, or how many items each of them reports.
At display time, those definitions are rendered once per item in a list the device reports. A device reporting four ports gets four sets of widgets, each bound to that port's own telemetry; a device reporting one gets one; a device reporting none shows nothing.
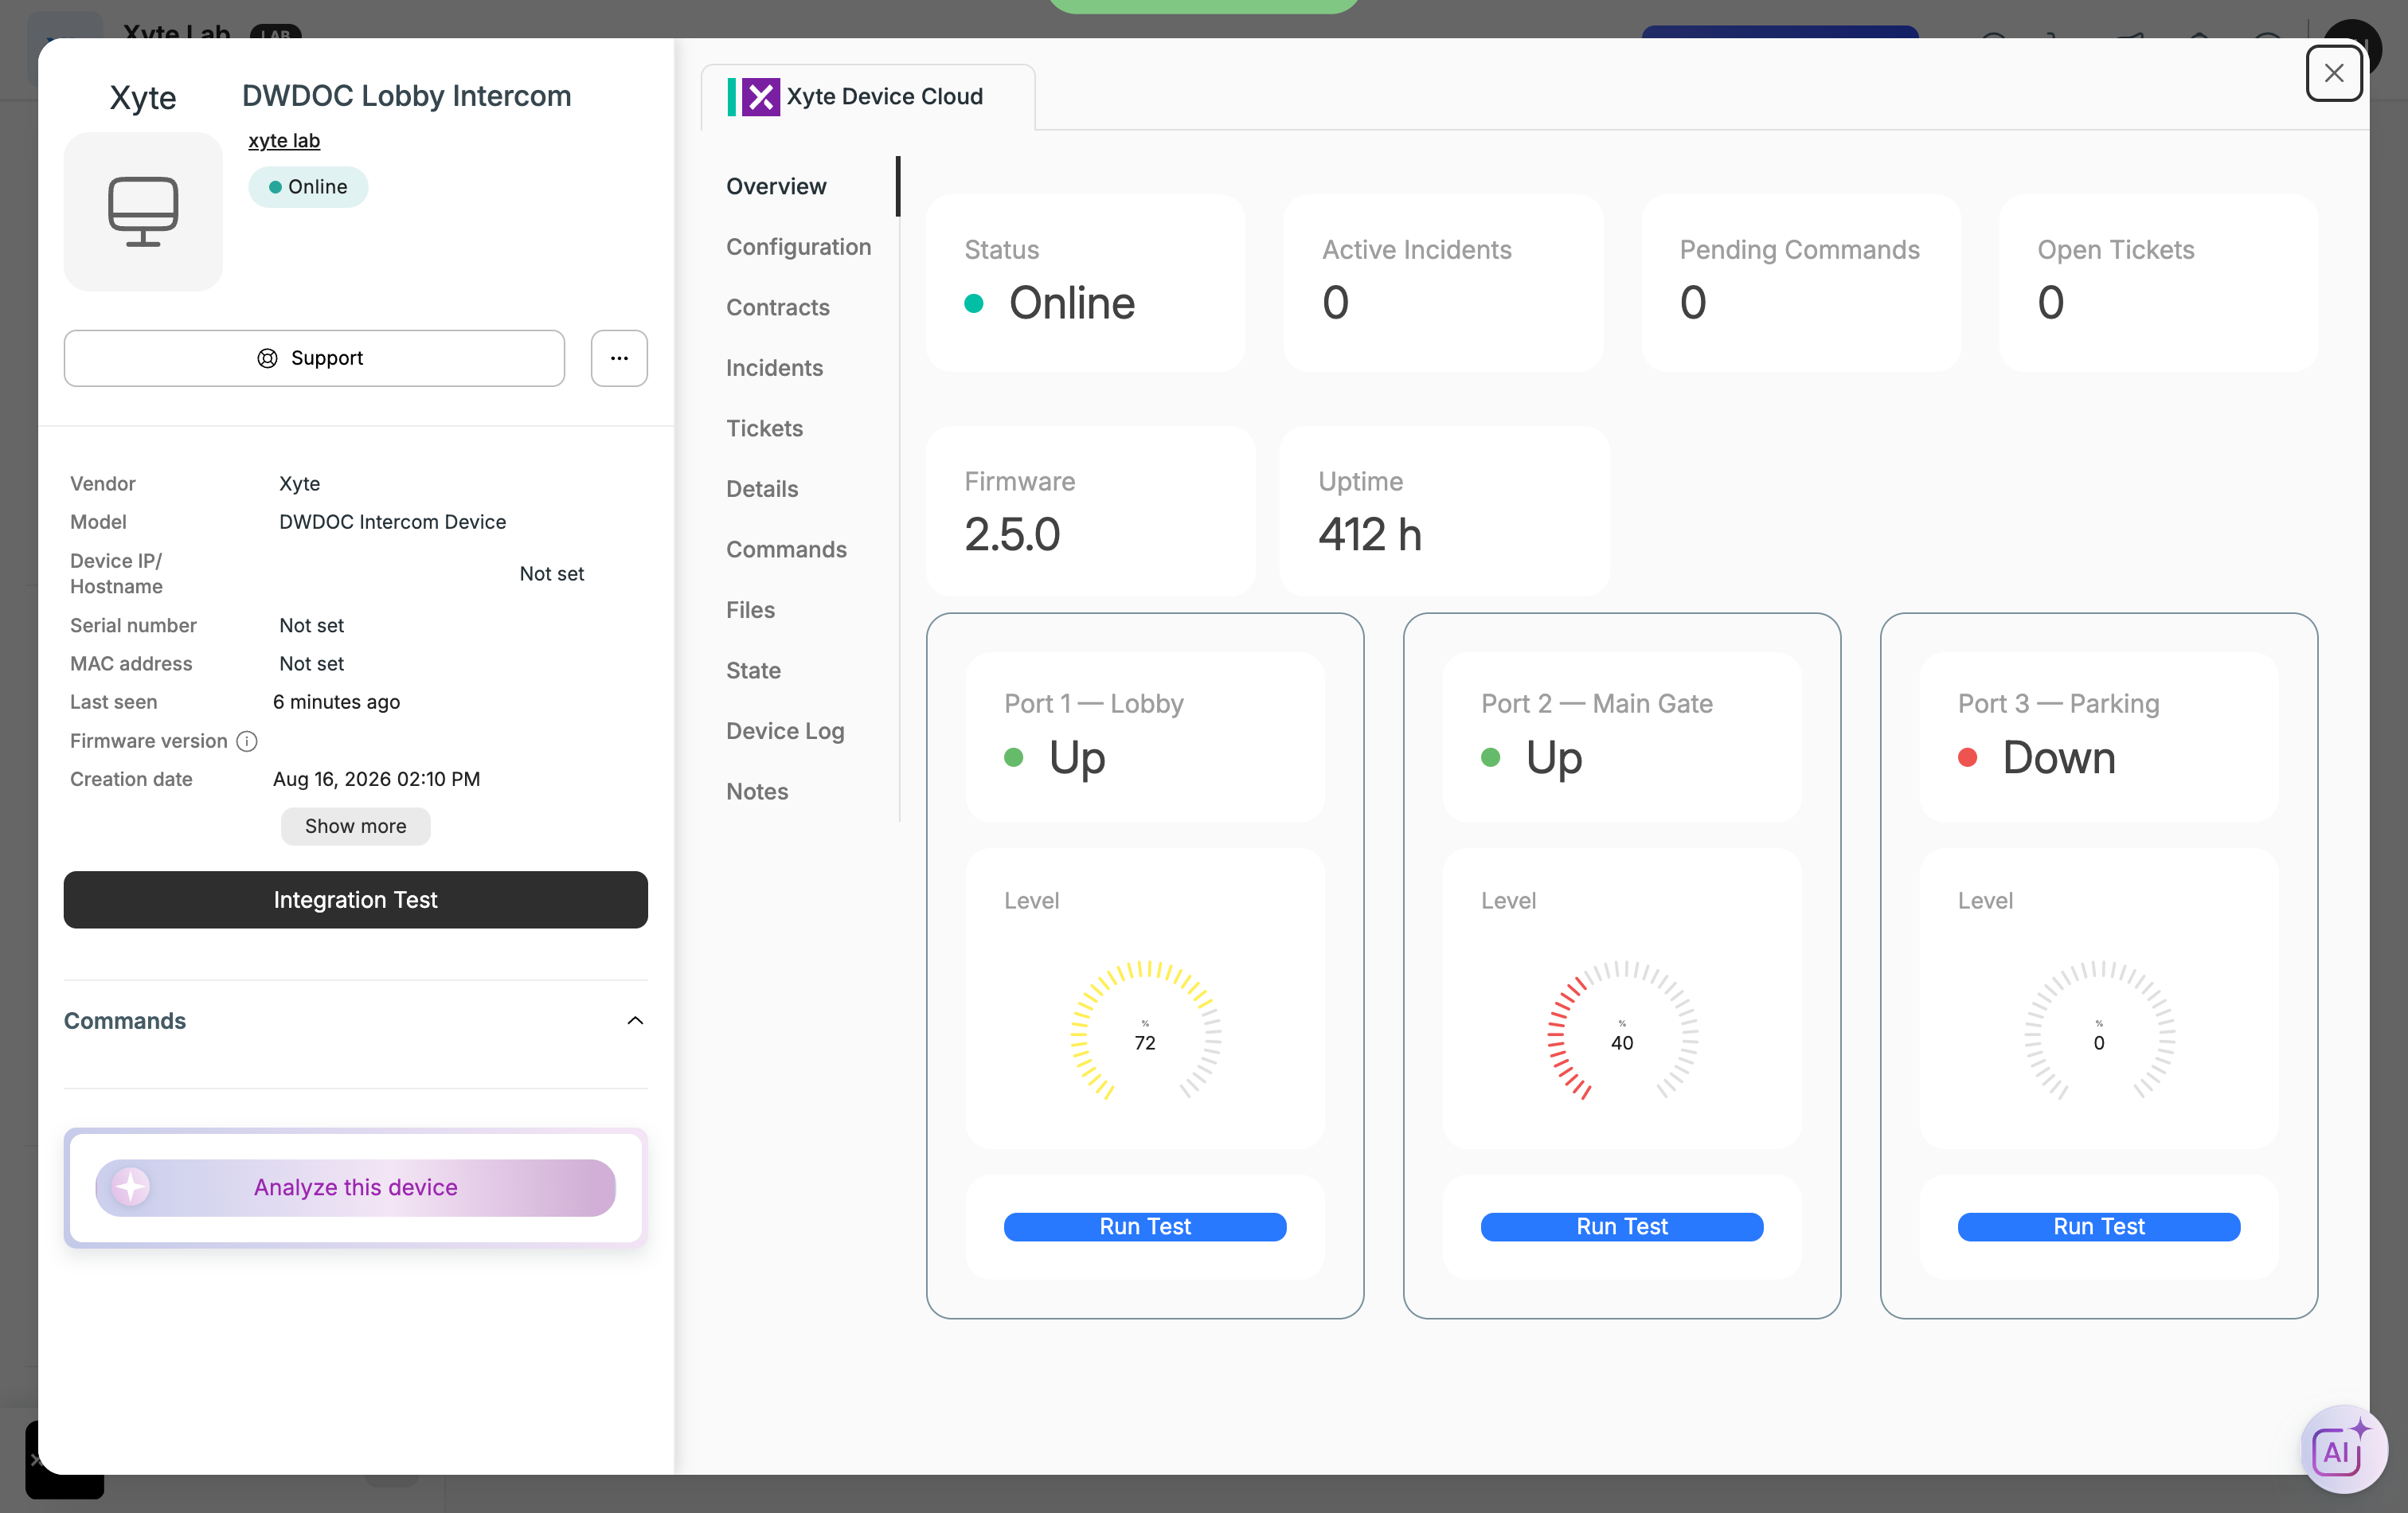
An example of the device Overview when using a dynamic section: this device reports three ports, and each one is rendered from the same single set of widget definitions.
Two features, two switchesDynamic sections are enabled per partner. If you don't see the Regular / Dynamic toggle when creating a section, contact Xyte support to have it enabled.
The Template custom field used for per-item commands (Step 5) is enabled separately. If Template doesn't appear in the field-type list, ask for that one too — having dynamic sections doesn't automatically give you it.
How it works
The device's Details act as a template, and its Telemetry supplies the values. You reference each item's keys as {placeholders} inside the widgets, and for every item the platform substitutes that item's values — producing the telemetry key the widget reads and the label it displays.
Step 1 — Report the list in Details
The path you bind to must resolve to an array of objects. Anything else (a plain object, a string, an empty value) renders nothing.
Send it with Update device:
{
  "details": {
    "ports": [
      { "id": 1, "name": "Lobby" },
      { "id": 2, "name": "Main Gate" },
      { "id": 3, "name": "Parking" }
    ]
  }
}
Keep the keys short and stable — they become your placeholder names.
Step 2 — Create the section
Set the type toggle to Dynamic, name the section, and set Data source path to the list, e.g. details.ports.
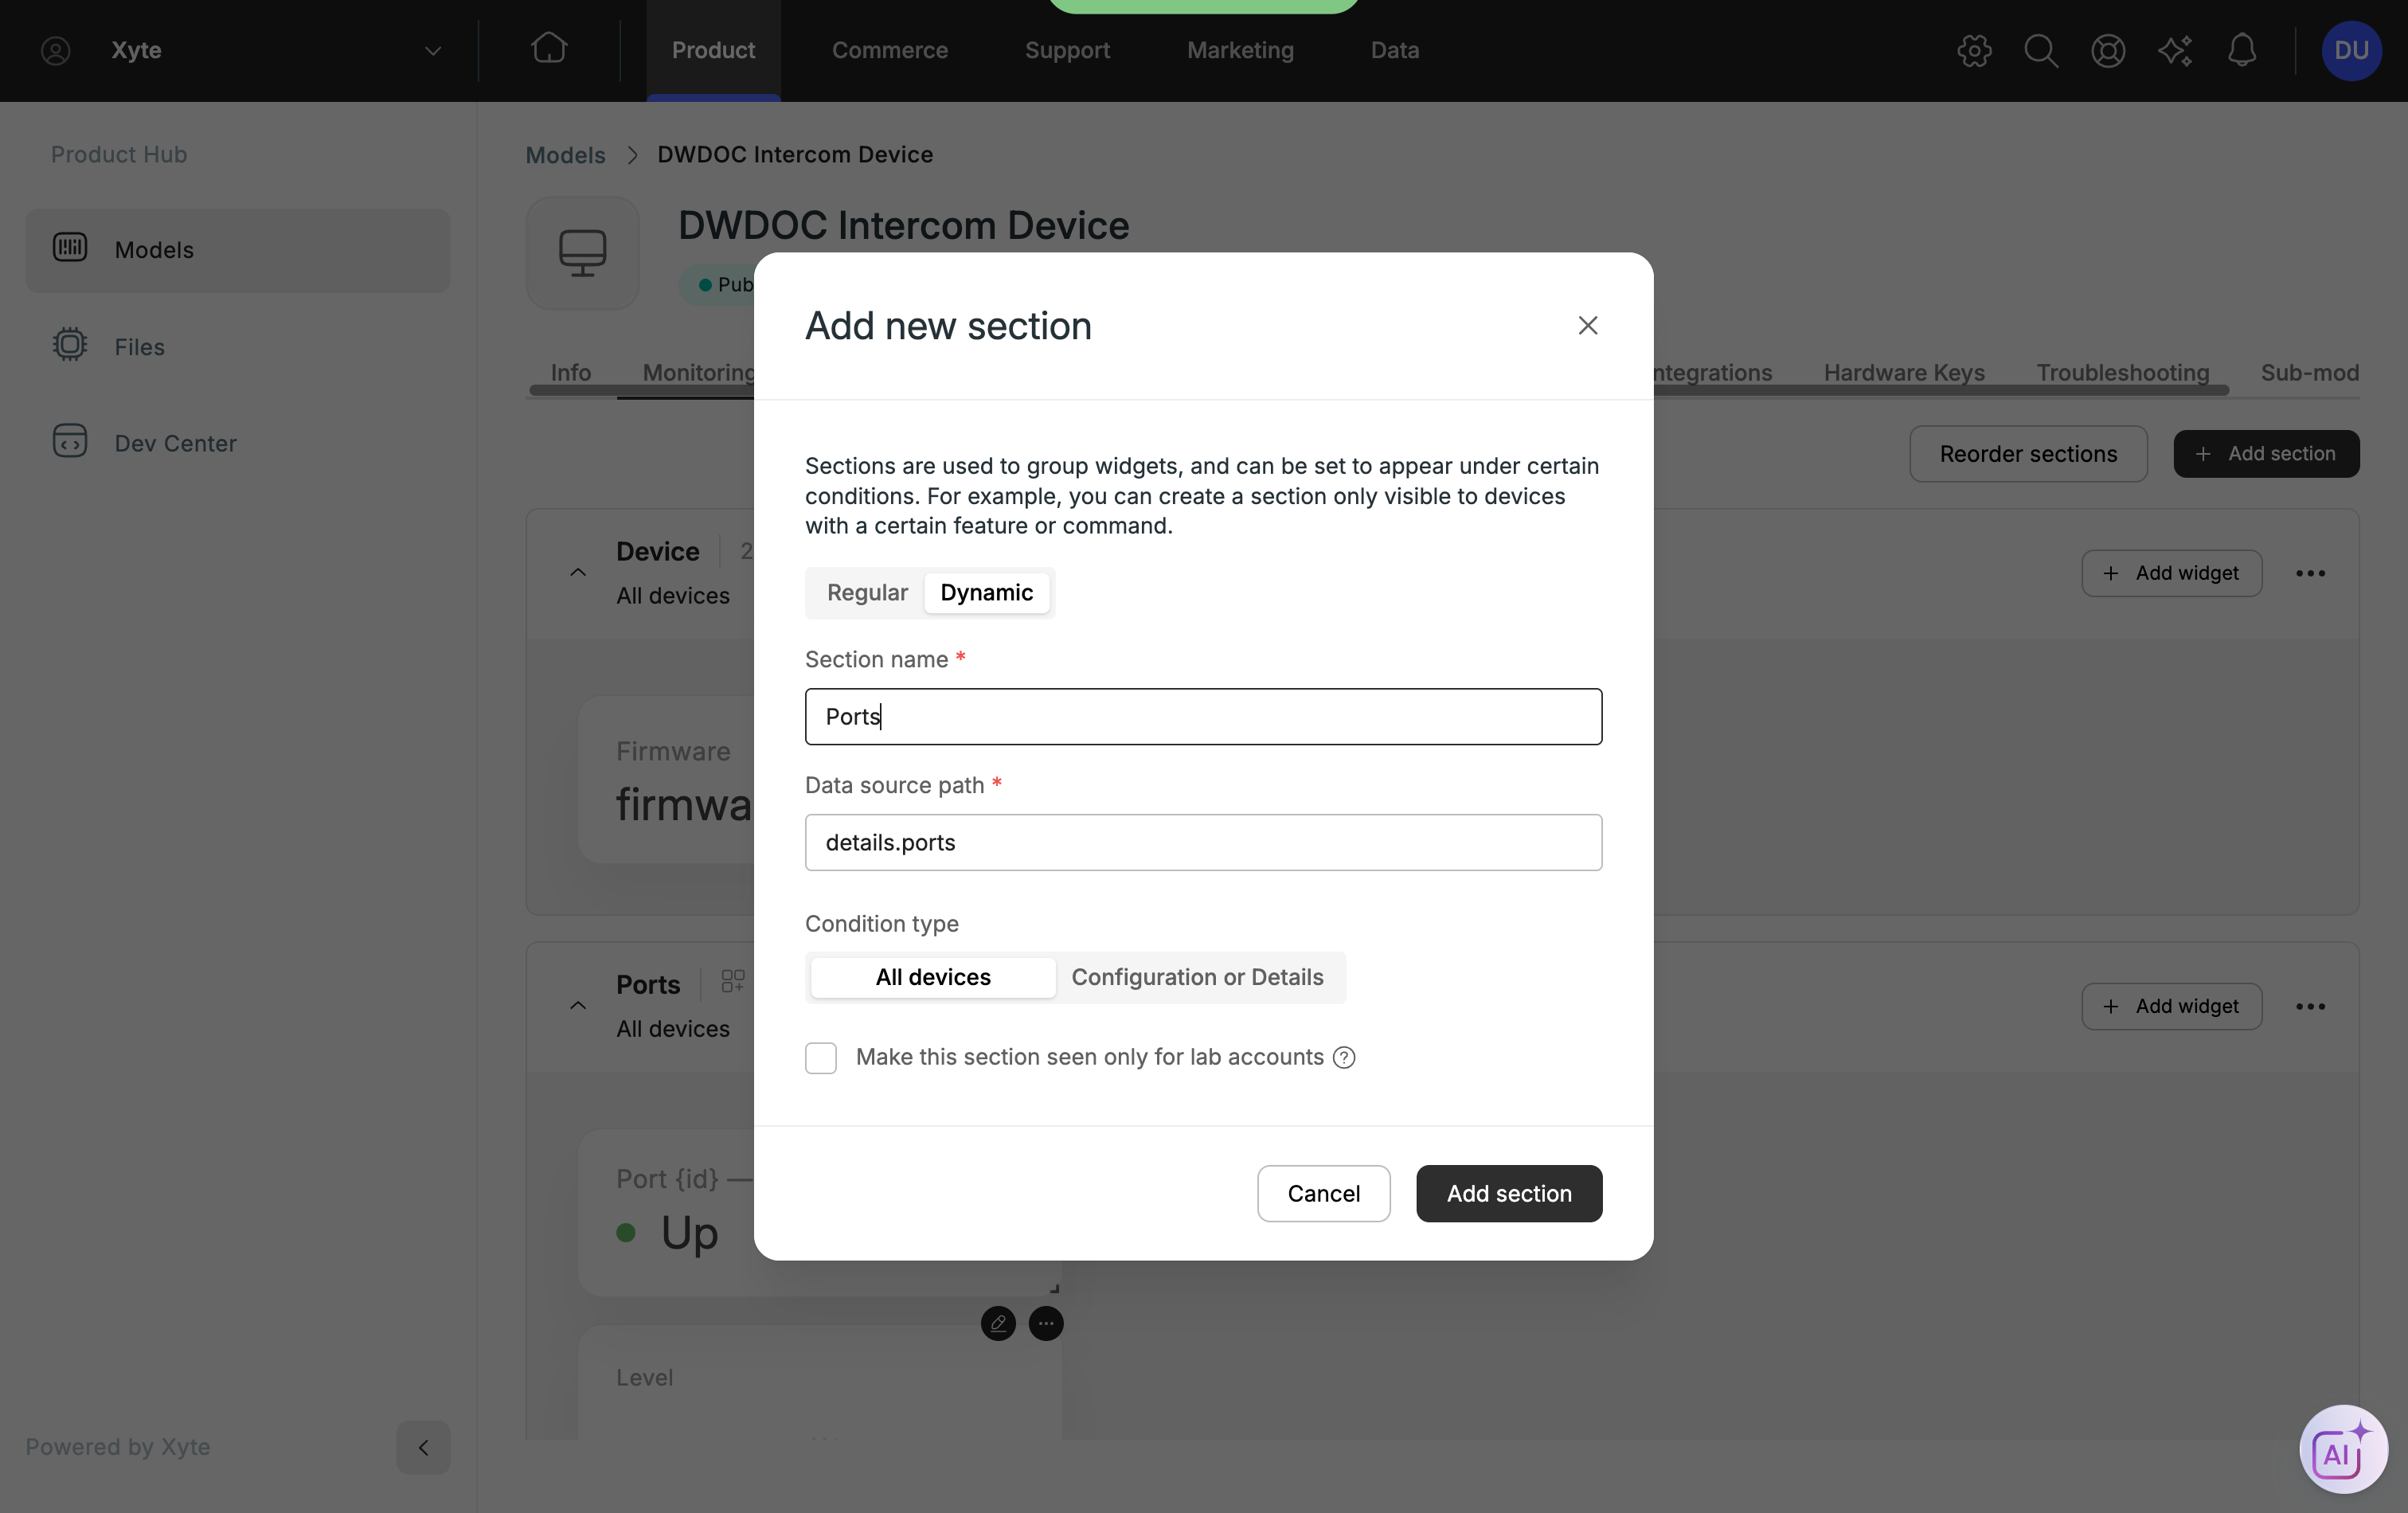
Condition type still applies — leave it on All devices, or add a condition to hide the whole section as described in the Conditional sections tab.
Step 3 — Add widgets that reference the item
Wherever a widget takes a name or a telemetry key, use {placeholder} — the name of a key from your Details items.
| Widget field | You enter | Device sees (item 2) |
|---|---|---|
| Name | Port {id} — {name} | Port 2 — Main Gate |
| Telemetry key | port_{id}_level | port_2_level |
Substitution applies to the widget's name, its telemetry key, and its title telemetry when "telemetry as title" is on.
In the model editor the widgets show the placeholders as written — they only resolve against a real device:
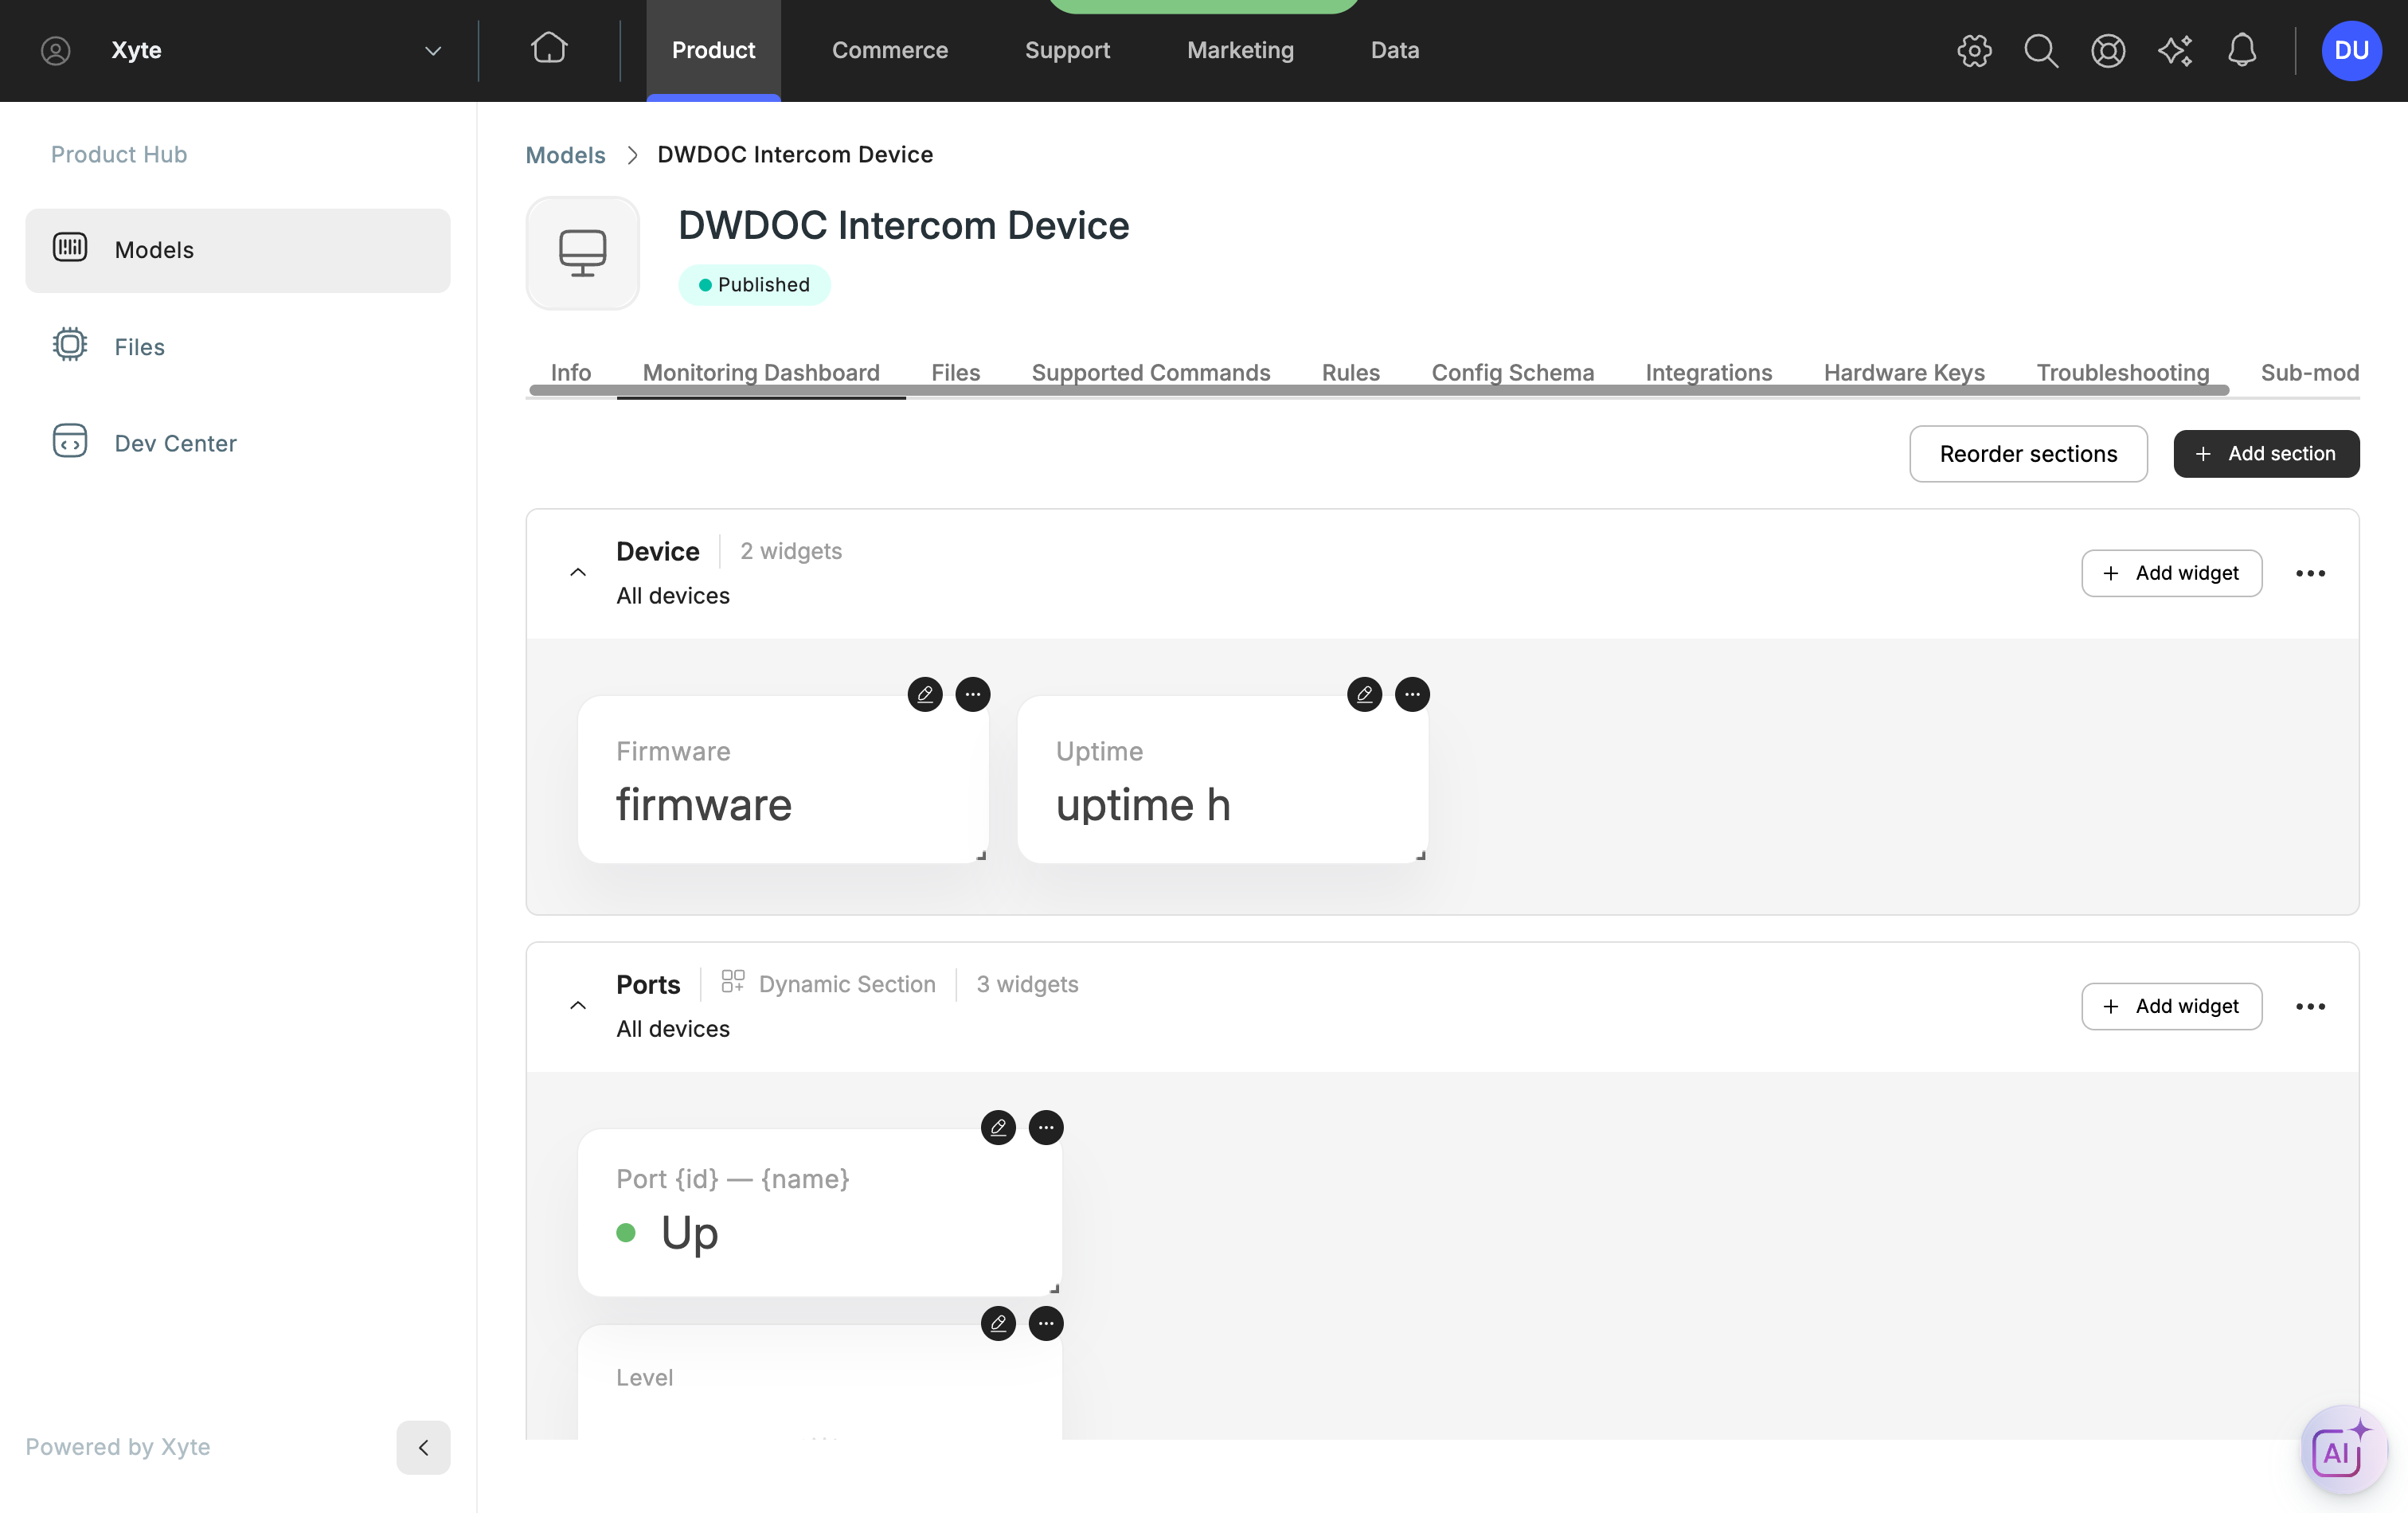
If a placeholder names a key that isn't present in the item, the text is left exactly as written rather than rendering blank — a useful signal that a key name doesn't match.
Step 4 — Send matching telemetry
Telemetry keys are flat and must match what the placeholders produce:
{
  "port_1_status": "up",   "port_1_level": 72,
  "port_2_status": "up",   "port_2_level": 40,
  "port_3_status": "down", "port_3_level": 0
}
Each group reads only the keys its own placeholders produce, so telemetry for one item never affects the others. Sending an update for port 2 alone moves only the middle group:
{ "port_2_level": 95 }Before — port 2 at 40:
After — port 2 at 95, ports 1 and 3 unchanged:
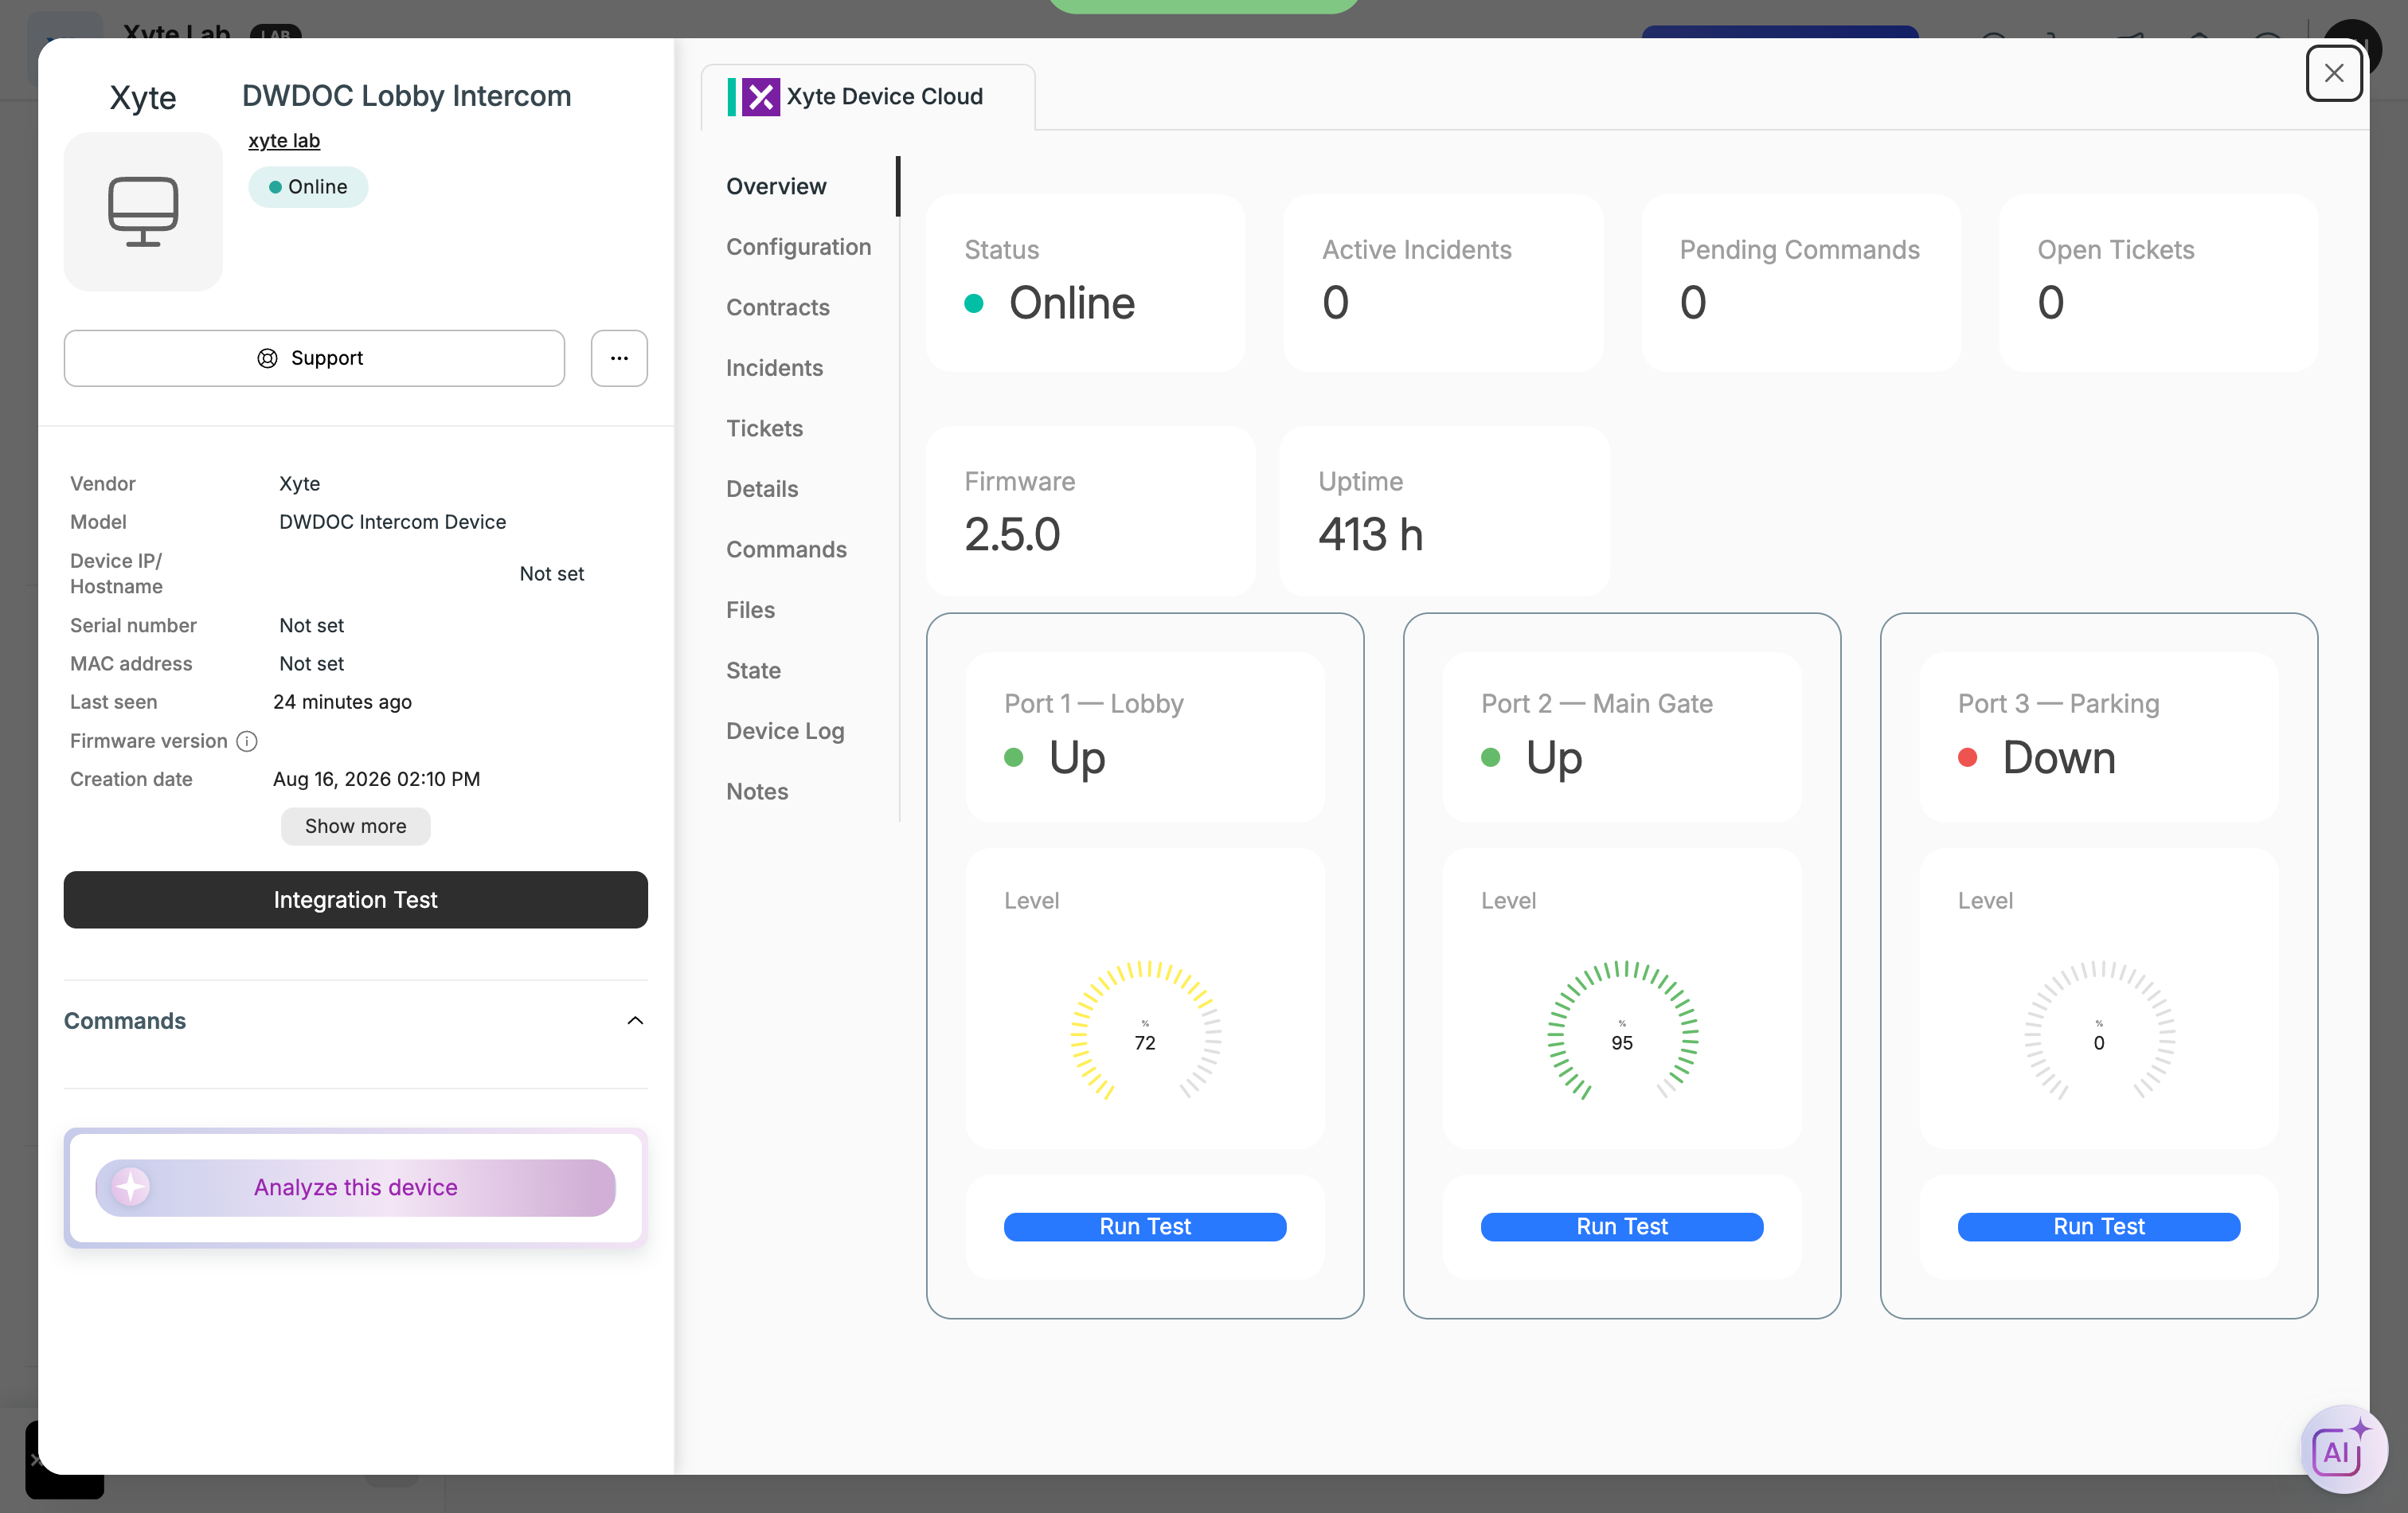
The gauge's colour follows the segments you configured on the widget, so the same widget definition renders differently per item — here port 2 crosses from the red band into the green one while port 1 stays amber and port 3 sits at zero.
Step 5 — Commands per item
To give each item its own action, use a Button widget bound to a command with a template custom field.
1. On the model, open Supported Commands and add a command.
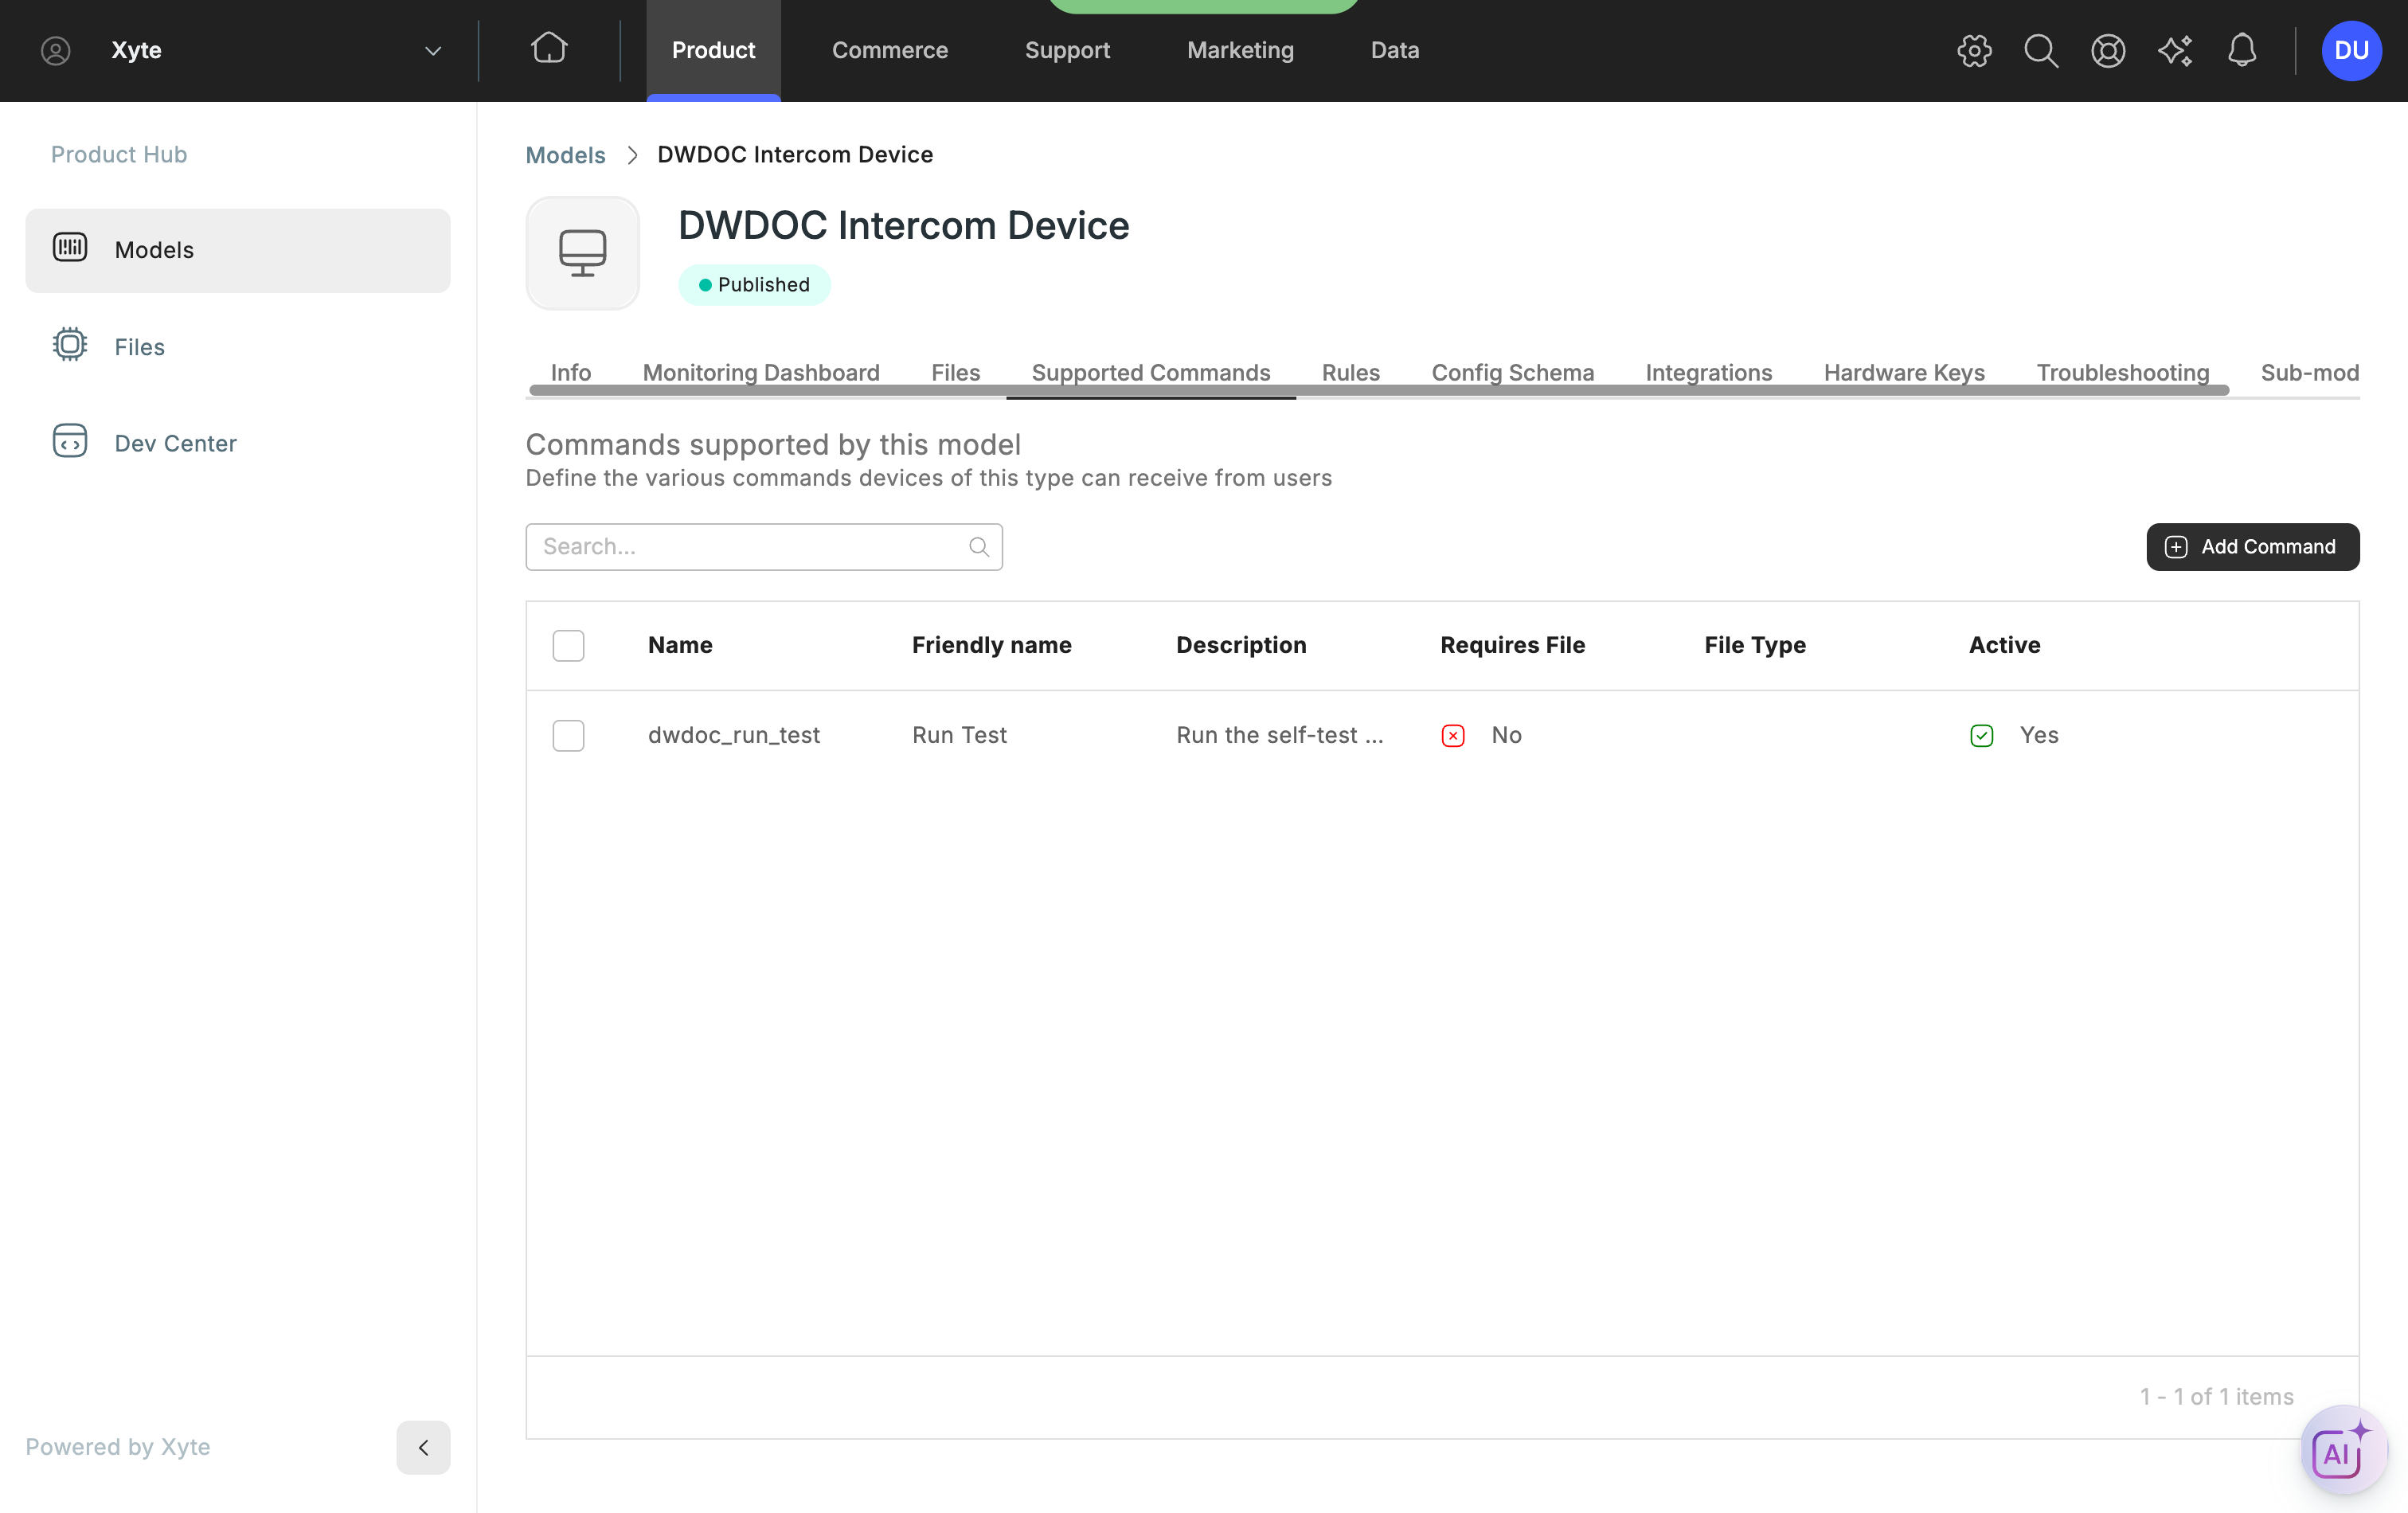
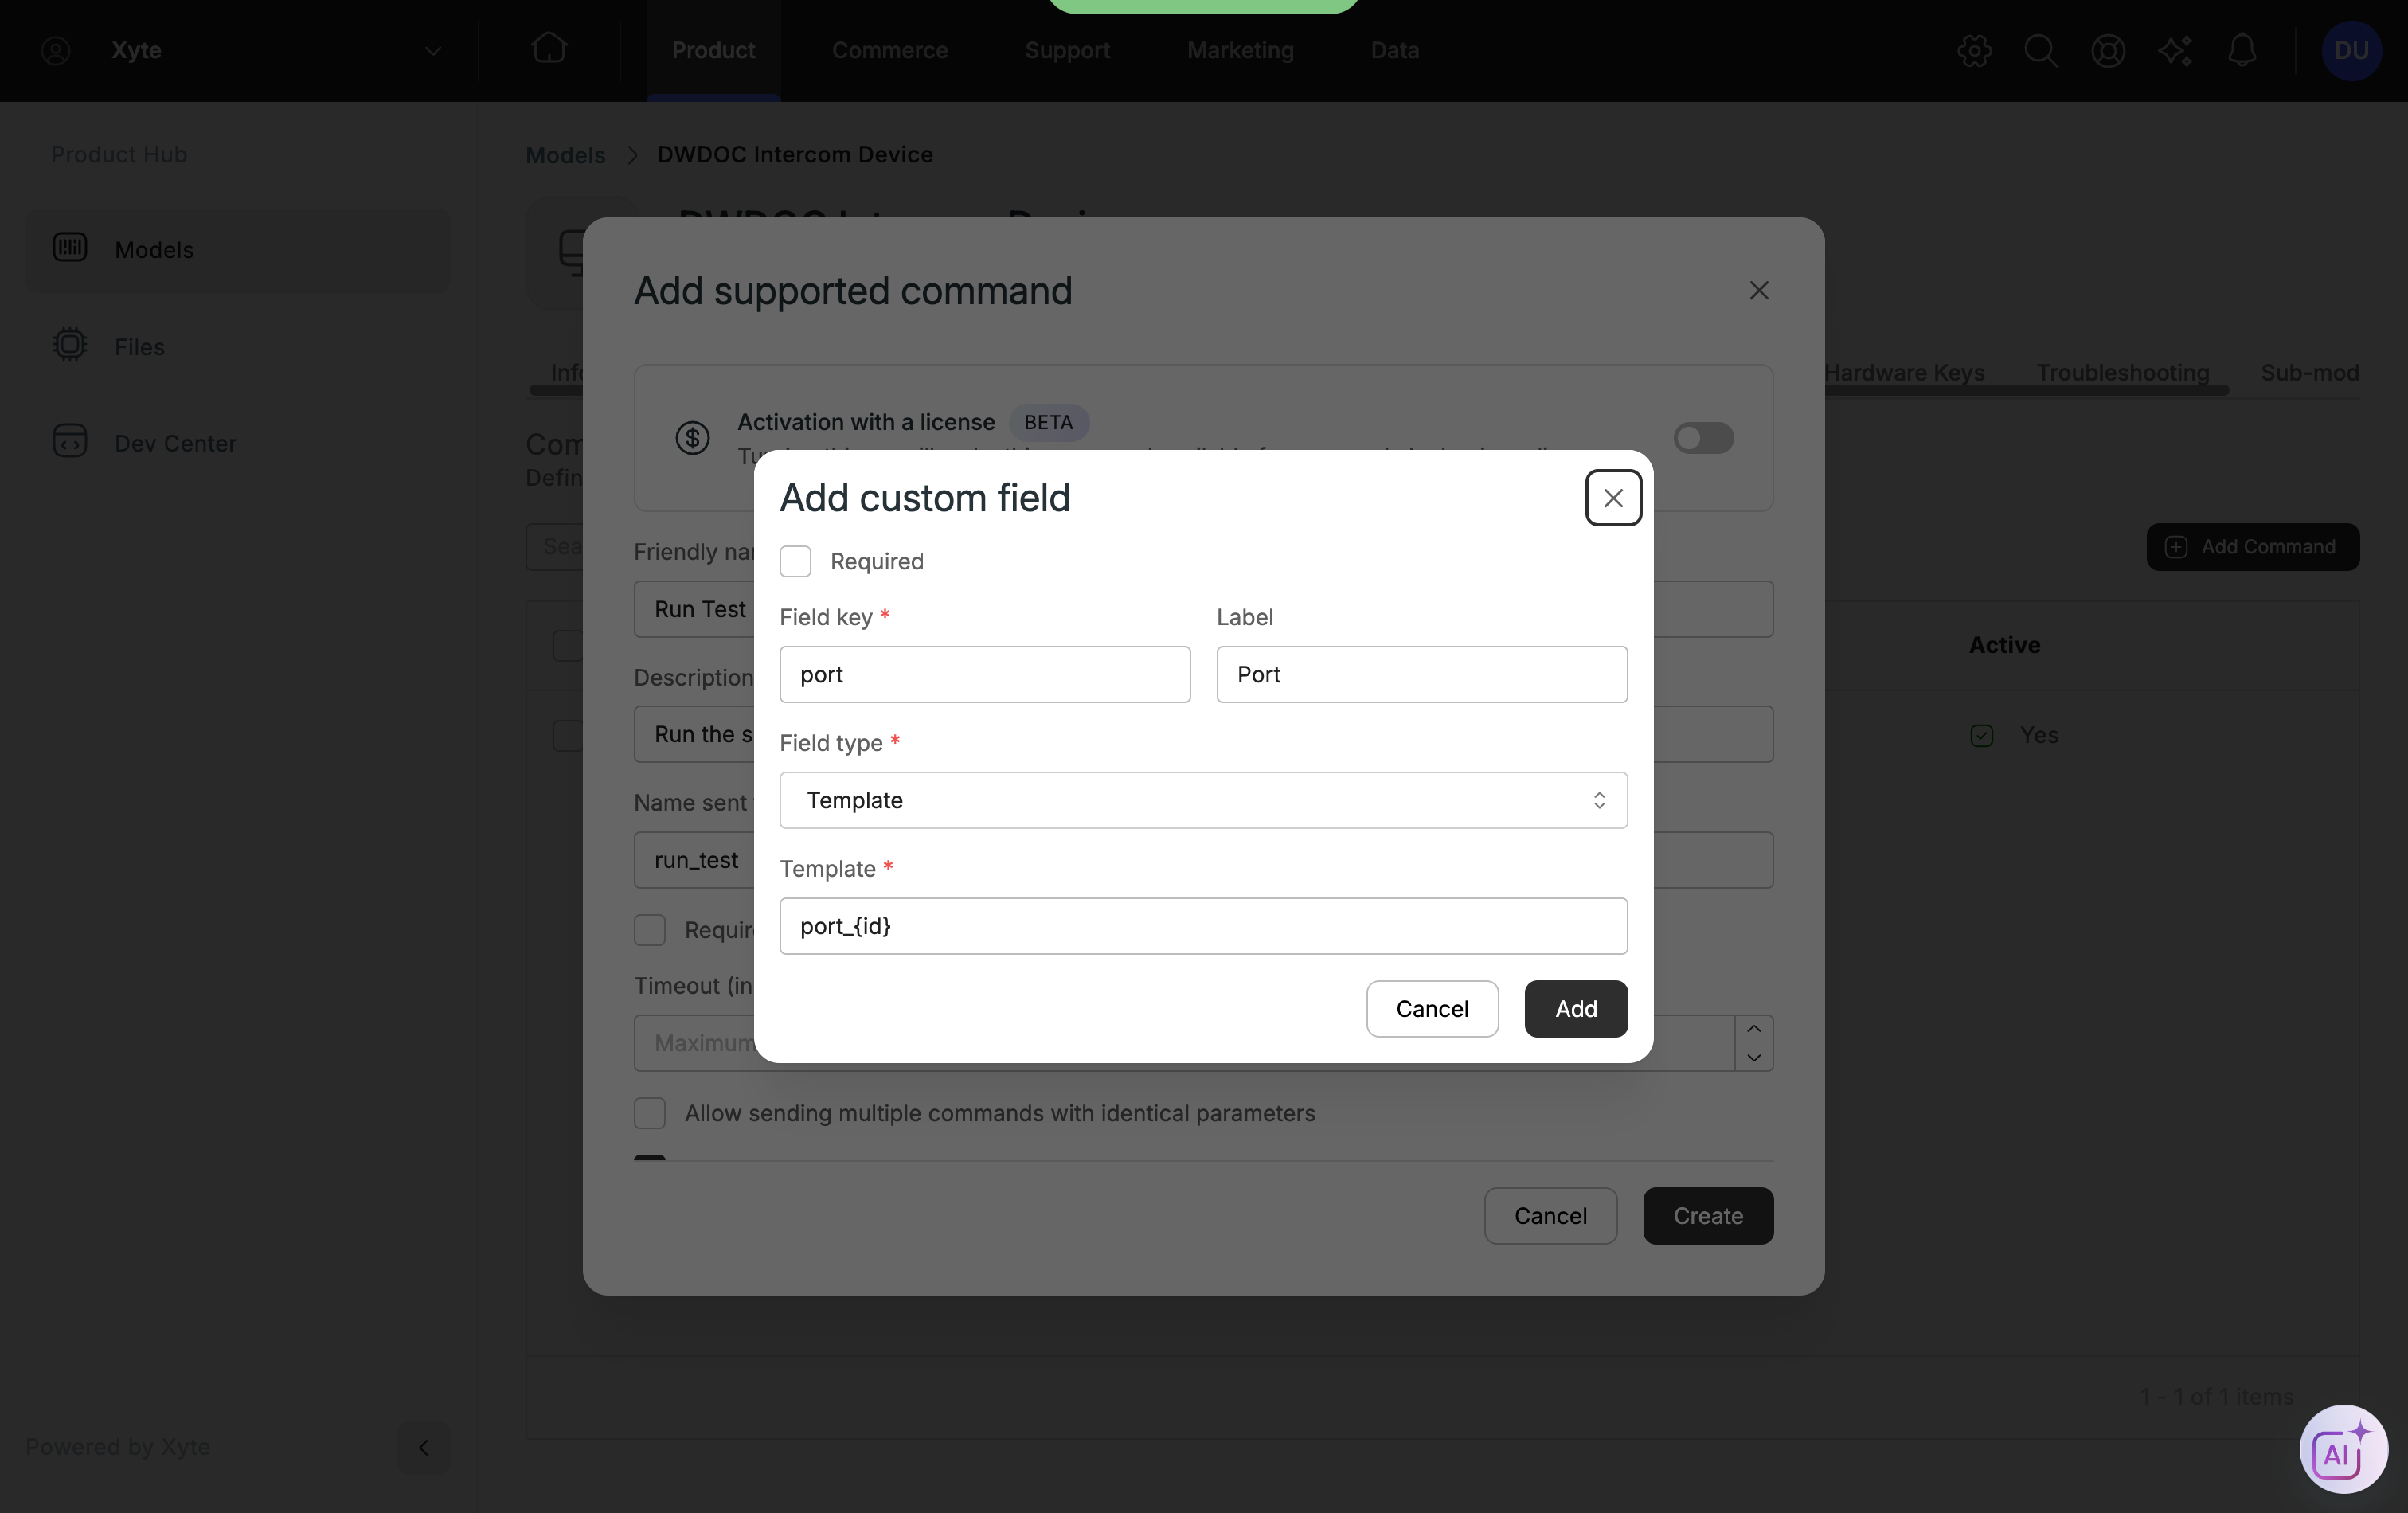
2. In the command, choose Add custom field. Give it a Field key, set Field type to Template, and write the template using the same placeholders as your widgets — e.g. port_{id}.
3. Back in the Monitoring dashboard, add a Button widget to the dynamic section and select that command.
Command values resolve exactly like widget values
The template field uses the same {placeholder} substitution as the widgets — it's one mechanism, applied in two places. For each rendered group, the item's values are filled into the widget's telemetry key and into the command's parameter:
| Where you write it | You enter | Item 2 resolves to |
|---|---|---|
| Widget name | Port {id} — {name} | Port 2 — Main Gate |
| Widget telemetry key | port_{id}_level | port_2_level |
| Command template field | port_{id} | port_2 |
So the button in a group is bound to the same item as the gauge sitting above it — no separate configuration, and no way for the two to drift apart.
What the customer sees
Every group gets its own copy of the button, labelled and wired to that item:
Pressing Run Test in the Port 2 — Main Gate group queues the command with that port's value already filled in:
{
  "name": "run_test",
  "params": { "port": "port_2" }
}
The same press from Port 1 — Lobby sends port_1. The command is then tracked in the device's Commands tab like any other:
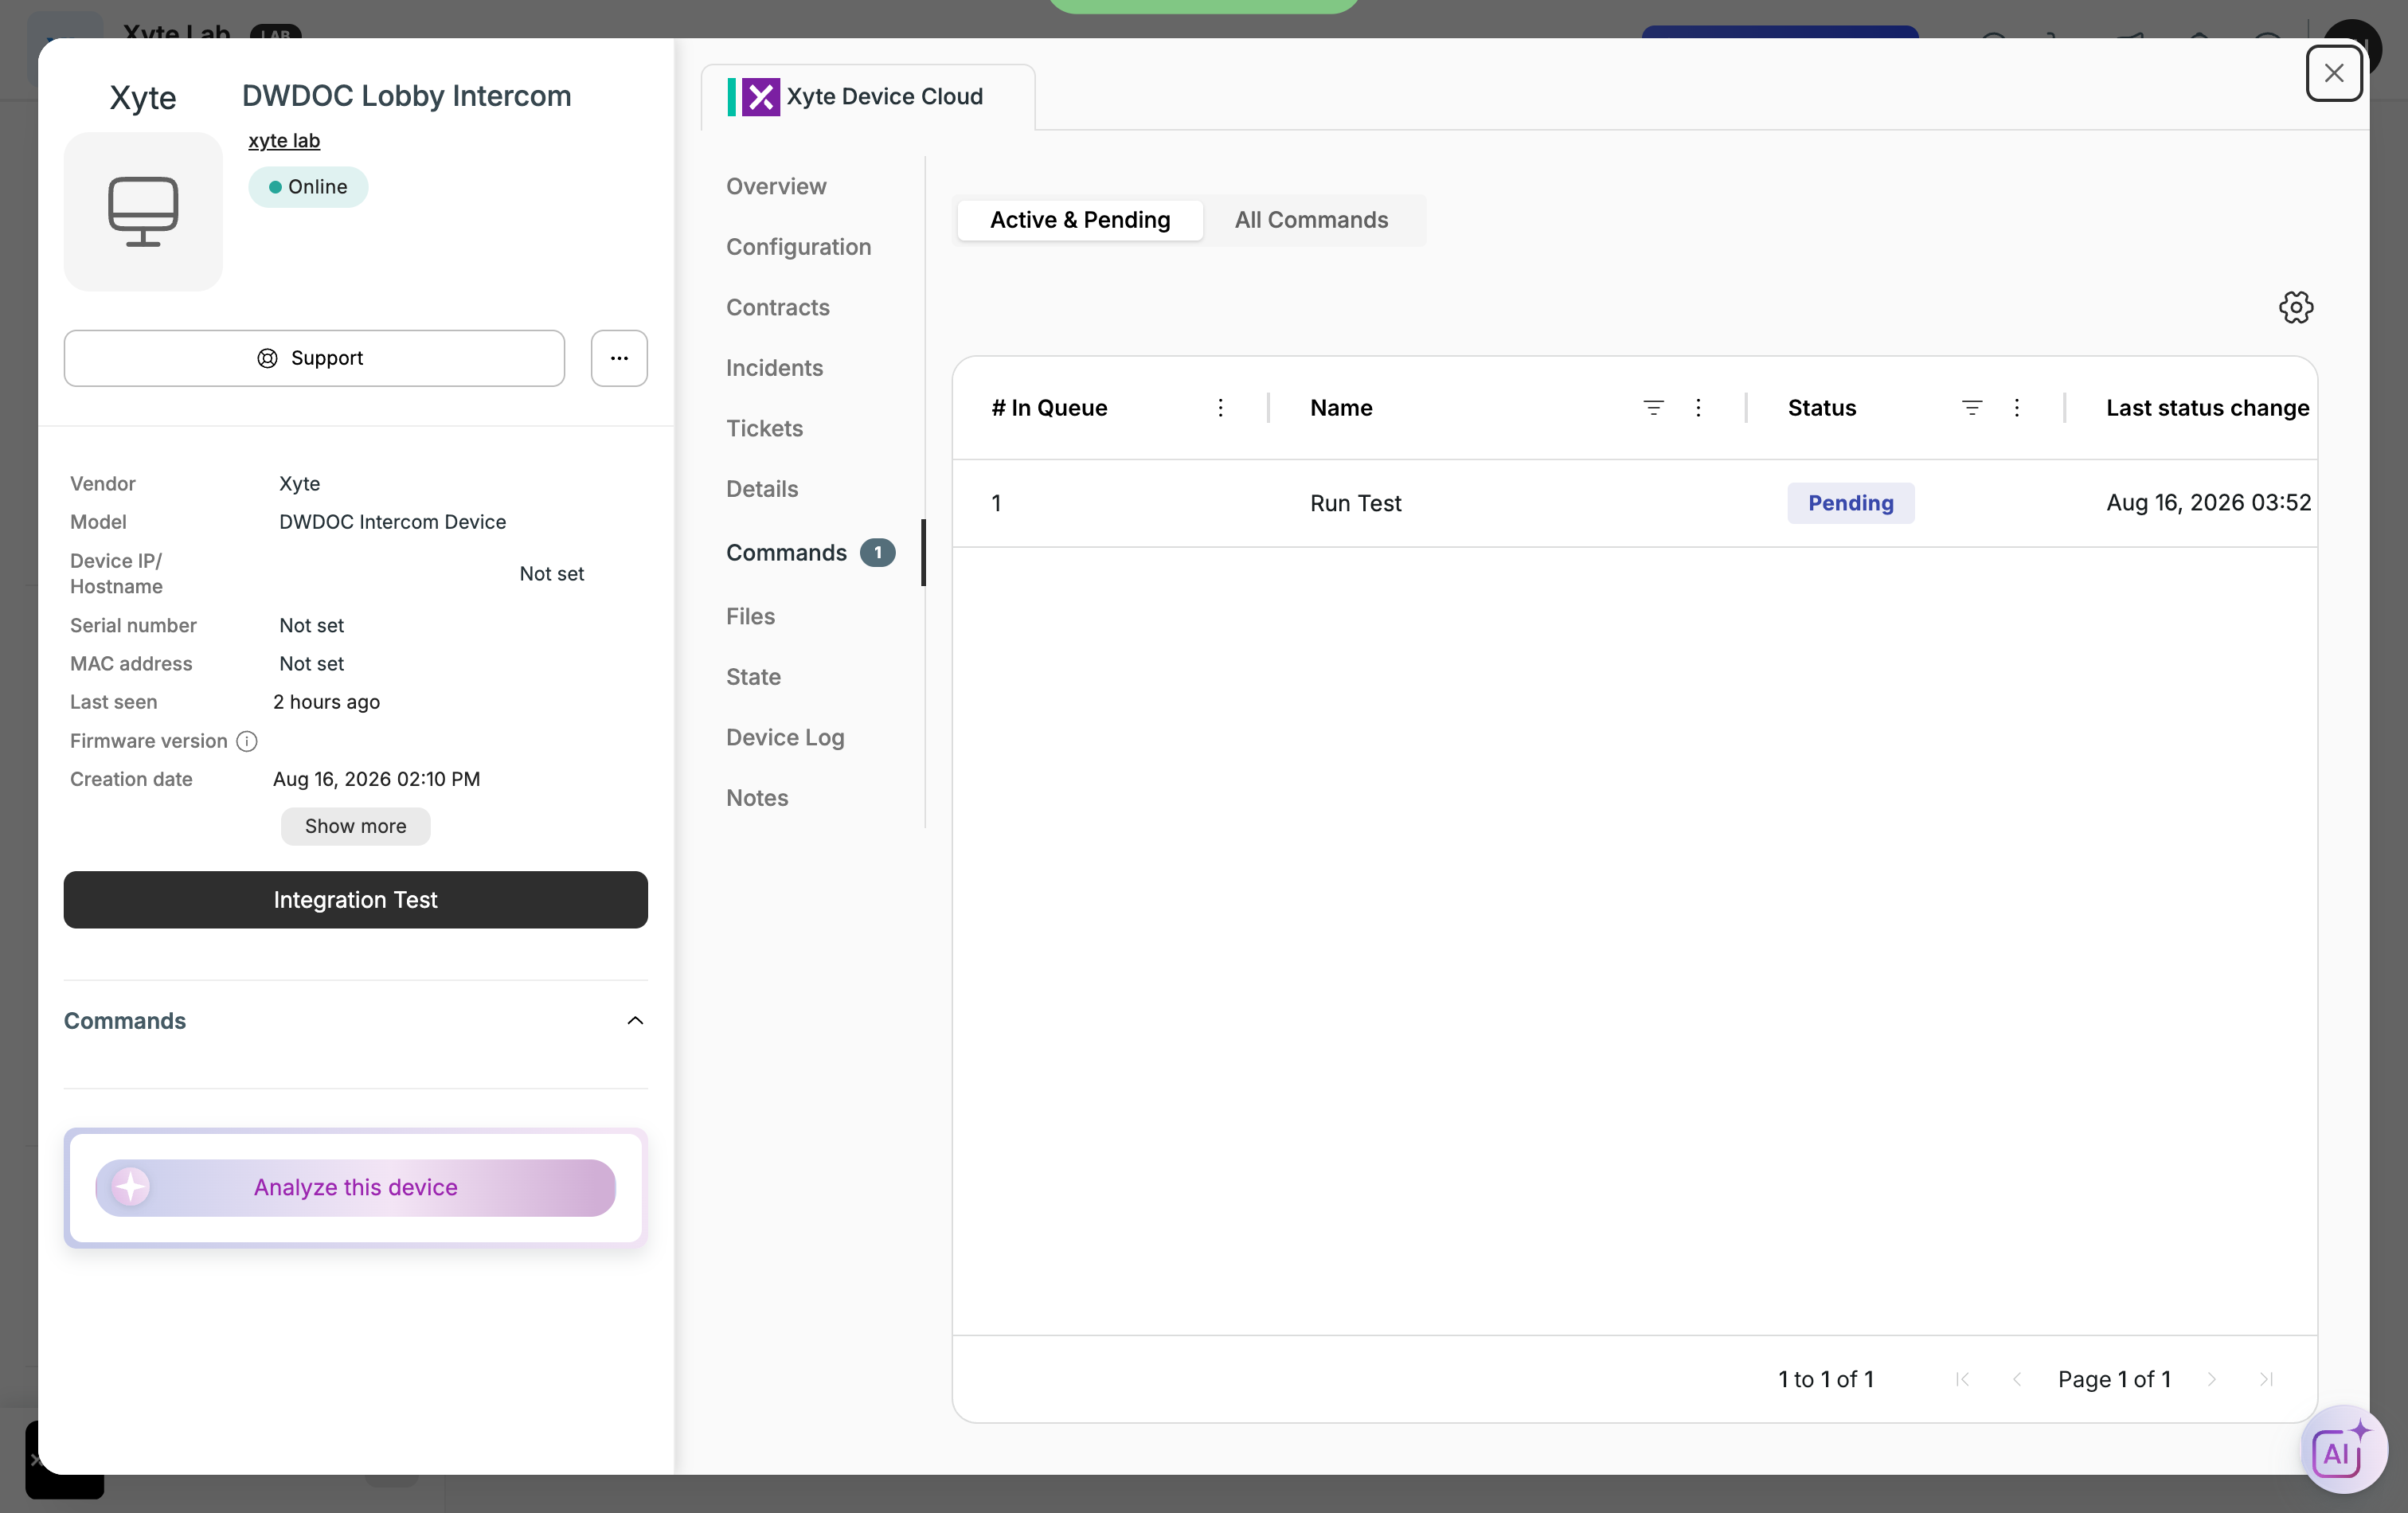
Other command parameters can be sent alongside the template field as normal.
Commands with template custom fields can only be selected inside a dynamic section. In a regular section they appear disabled.
Layout
Each item renders as a bordered group containing that item's widgets. Groups are laid out side by side and wrap onto further rows, with the number per row derived from how wide your widgets are — narrow widgets pack several groups per row, wide ones fewer.
This makes a dynamic section the way to get several small, independently-appearing controls onto one row, instead of one full-width row each.
Supported widgets
Placeholder substitution works with: Status, Numeric, Value, Text, Header text, Bar indicator, Gauge indicator, and Button (for commands).
Other widget types can be placed in a dynamic section but won't rebind per item — their data comes from fields that aren't substituted.
Troubleshooting
| Symptom | Likely cause |
|---|---|
| Section renders nothing | The data source path doesn't resolve to an array of objects — check for a single object, or a typo in the path |
Widget shows port_{id}_level literally | The placeholder key isn't present in the Details items |
| Widget renders but shows no value | The generated telemetry key doesn't match the key the device sends |
| No Dynamic option when creating a section | The feature isn't enabled for your account — contact Xyte support |
| Command not selectable on the Button widget | Commands with template fields only appear inside dynamic sections |
Updated 17 days ago